


A research team at Northern Arizona University has been exploring the relationship between new data on daily traffic and the number of COVID-19 cases in the United States. The analysis shows that prior to the end of March, U.S. traffic activity—a useful proxy for a return to pre-COVID economic activity—declined rapidly as the number of COVID-19 cases increased. However, since that time, traffic activity and COVID-19 cases have been exhibiting strong regional patterns, with states such as California and Texas showing traffic increases followed by a rise in COVID-19 cases. Other states such as New York and New Jersey, by contrast, show a rise in traffic activity but a decline in COVID-19 cases.
“During March, the country appeared to move as one, with traffic activity declining dramatically as COVID-19 cases increased. From April, that began to break down. Now we see traffic activity increasing everywhere, but with a very different COVID-19 trend from state to state,” said lead research scientist Pawlok Dass, a postdoctoral scholar in NAU’s School of Informatics, Computing, and Cyber Systems.
The team used newly available traffic data from StreetLight, a platform that estimates the number of Vehicle Miles Travelled (VMT) using anonymized location data from smartphone and navigation devices. After aggregating the original county-scale data to the state-scale, the team combined the daily, state-scale VMT and COVID-19 statistics with daily COVID-19 data made available by The New York Times based on reports from state and local health agencies to explore to what extent traffic activity might act as a proxy for the spread of COVID-19.
“The availability of these types of mobility data have been one of the positive outcomes of this difficult period,” Dass said. “Our ability to understand elements of human activity in response to this pandemic has been advanced significantly by data such as what we are getting from StreetLight.”
In addition to the different state-by-state trends in relation to traffic activity, the state-by-state breakdown reveals that some states show a strong time lag between traffic and COVID-19.
“In many states, traffic appears to be a leading indicator, increasing first, with COVID-19 cases rising after a delay of up to 11 days,” said professor Kevin Gurney, head of the NAU research group analyzing the data. “Notable exceptions to this are New York, New Jersey, Pennsylvania and Massachusetts where, although traffic is gradually returning to normal, COVID-19 cases are steady or declining.”
The team speculated that states with increasing traffic but little increase in COVID-19 cases may offer insights on what policies or guidelines are showing the greatest success at keeping new COVID-19 cases low while emerging from lockdown.
The researchers caution that the analysis remains preliminary and is sensitive to the veracity and comprehensiveness of testing and reporting. Final analysis will be included in a future scientific publication.
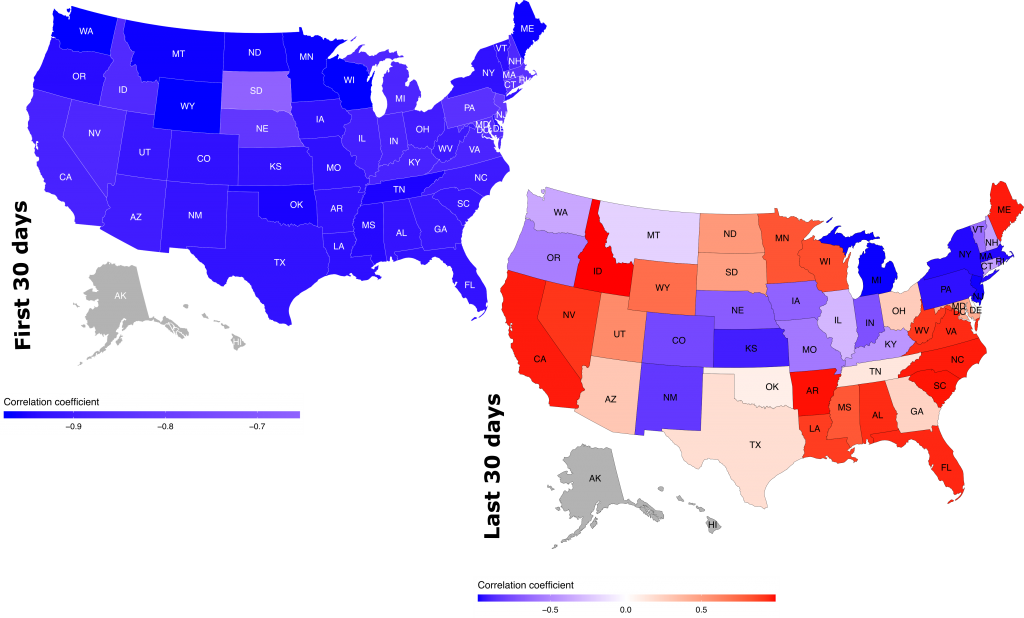
Top image: The upper left panel shows that during the month of March 2020, the decline in traffic across the U.S. coincided with the rise in COVID-19 cases. The lower panel shows how the traffic-COVID-19 relationship correlates with increased traffic in most states, while cases rise in some and fall in others.

Kerry Bennett | Office of the Vice President for Research