Cities have become critical players in reducing the greenhouse gas (GHG) emissions that are causing global climate change. Urban areas produce almost 70 percent of those emissions, and city governments are proposing a variety of policy actions aimed at reducing them. Many cities also produce inventories that detail their greenhouse gas emissions.
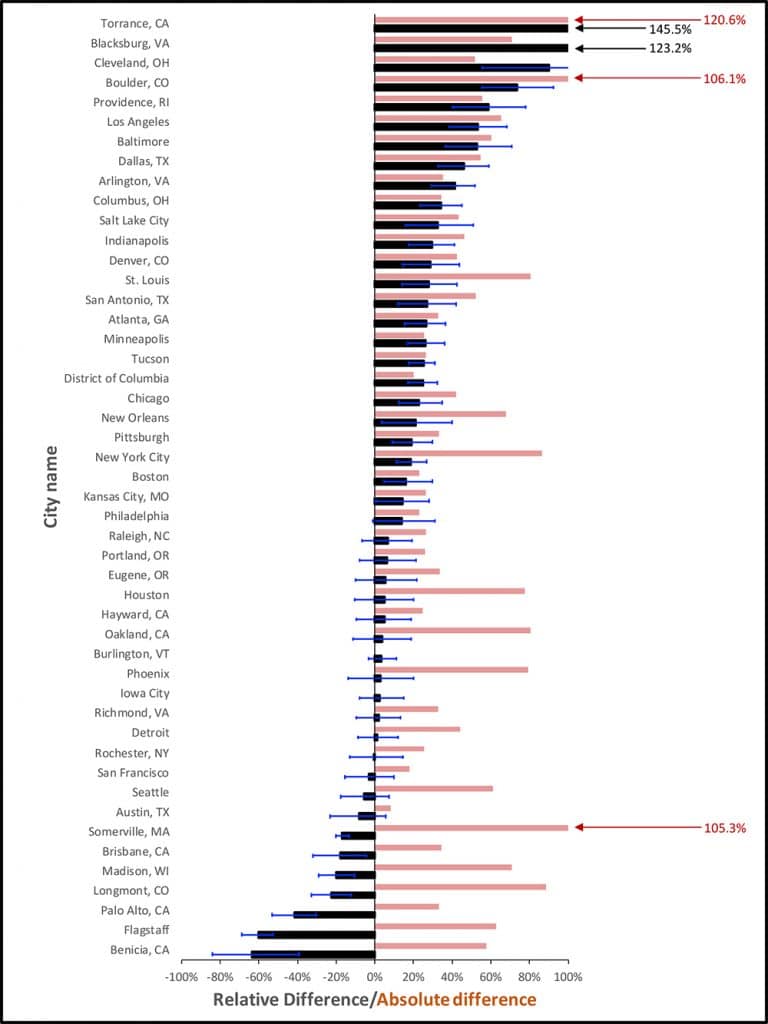
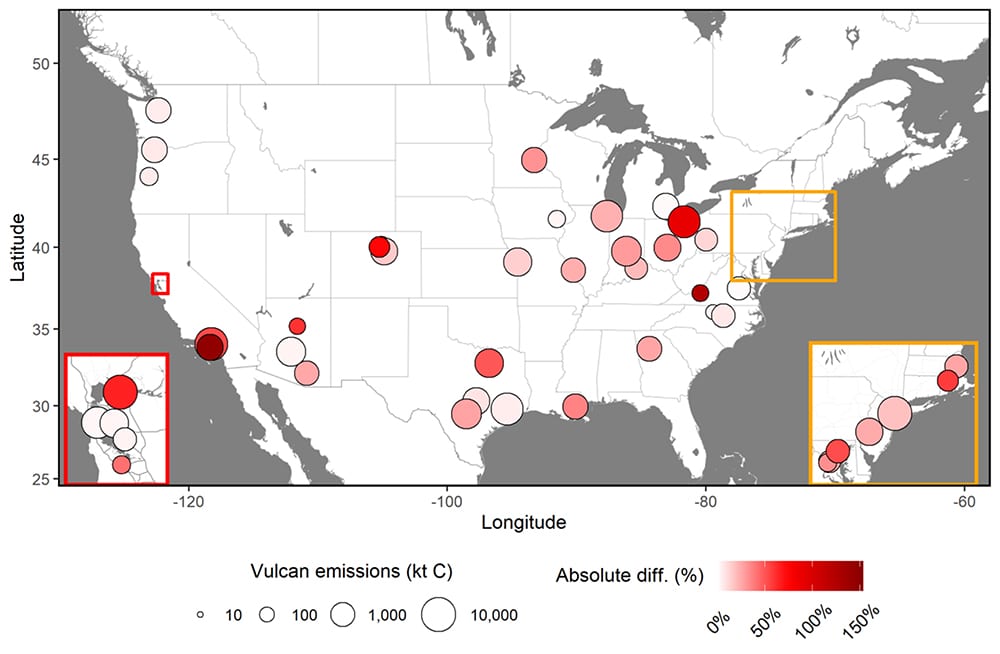
Now, professor Kevin Gurney of Northern Arizona University’s School of Informatics, Computing, and Cyber Systems and colleagues have compared the self-reported emissions inventories published by 48 major U.S. cities to estimates from a state-of-the-art emissions information system. As described in Nature Communications, Gurney and his research collaborators found large differences and a systematic under-reporting of urban emissions by cities.
Gurney, who specializes in atmospheric science, ecology and climate policy, has spent two decades developing a standardized system for quantifying greenhouse gas emissions under his Vulcan and Hestia Projects. The system, funded by the National Aeronautics and Space Administration (NASA) and the National Institute of Standards and Technology (NIST), quantifies and visualizes greenhouse gases emitted across the entire country down to individual power plants, neighborhoods and roadways.
The emissions estimates generated by the system help identify problem areas and enable better decisions about where to cut emissions most effectively. Two recent studies, at the nationwide level and within the city of Indianapolis, Indiana, have shown that Gurney’s estimates are consistent with estimates based on direct atmospheric monitoring, a key independent form of independent validation.

“The results of this comparison were surprising,” Gurney said. “The differences were large and varied widely from one city to the next. When averaged, the self-reported emissions were almost 20 percent below the emissions estimated by the Vulcan system.” But that average doesn’t tell the whole story: for example, Cleveland, Ohio reported emissions 90.1 percent below the Vulcan estimate while Palo Alto, Calif., reported emissions 41.7 percent greater than the Vulcan estimate.
In order to prioritize and track emission reductions, cities will need an unbiased understanding of their emissions.
“The adage ‘you can’t manage what you can’t measure’ is really applicable here,” Gurney said. “Cities need a comprehensive and accurate assessment of their emissions. Without it, they could target the wrong emissions sources in their landscape for emission reduction or think they are on an emissions trajectory to meet their target, when in fact, they are not.”
For example, the city of Indianapolis aims to make a 20 percent reduction in GHG emissions from buildings by 2025 relative to 2016 values. With the 26.9 percent underestimate found in the study, it will be difficult to track progress towards this target or know when and if it has been achieved.
“Consistency in estimating emissions from one city to the next is also critical to comparing and contrasting different mitigation approaches and policies,” Gurney said. “This allows cities to borrow emission mitigation policies from others with similar emission characteristics. The inconsistencies in self-reported inventories make that very difficult.”
The approach taken by the research team uses a consistent method across all cities in the U.S., combining federal, state and local data systematically.
“It is expensive and time-consuming for cities to build accurate urban greenhouse gas inventories,” said Geoffrey Roest, an NAU postdoctoral researcher and co-author of the study. “But we have emissions data for every city in the U.S., and we can collaborate with cities to help them produce comprehensive, accurate inventories from that data.”
The research team found the differences between the self-reported inventories and the Vulcan estimates were likely due to cities not accounting for particular fuels or sectors where local information was limited or difficult to come by.
“Vulcan data can be adapted to meet the needs of different cities by incorporating local data” said Yang Song, an NAU postdoctoral researcher and co-author on the study. “This will help cities identify the most effective strategies toward true and lasting emission reductions backed by the best science.”
Data from the Vulcan project are available on the Oak Ridge National Laboratory Data Archive. Additional imagery is available on the Vulcan website. A video describing the Vulcan Project is available on YouTube, as is an animated video of the Vulcan Project output. This research was supported by NASA grant NNX14AJ20G, the National Institute of Standards and Technology grant 70NANB16H264N and the French research program Make Our Planet Great Again (project CIUDAD).
Gurney joined NAU in 2018, where he is continuing the research begun at Purdue and Arizona State University. He has been involved with the UN Climate Change Framework Convention and the Kyoto Protocol for 25 years and is a lead author for the Intergovernmental Panel on Climate Change (IPCC). In addition to his interests in carbon cycle science and policy, he has worked on stratospheric ozone depletion, radionuclide dose assessment, energy systems and climate-economic modeling.


