


When it comes to climate, what happens in the Arctic doesn’t stay in the Arctic. The effects of Arctic warming are a harbinger of what’s coming to all terrestrial biomes, including the deserts of Arizona.
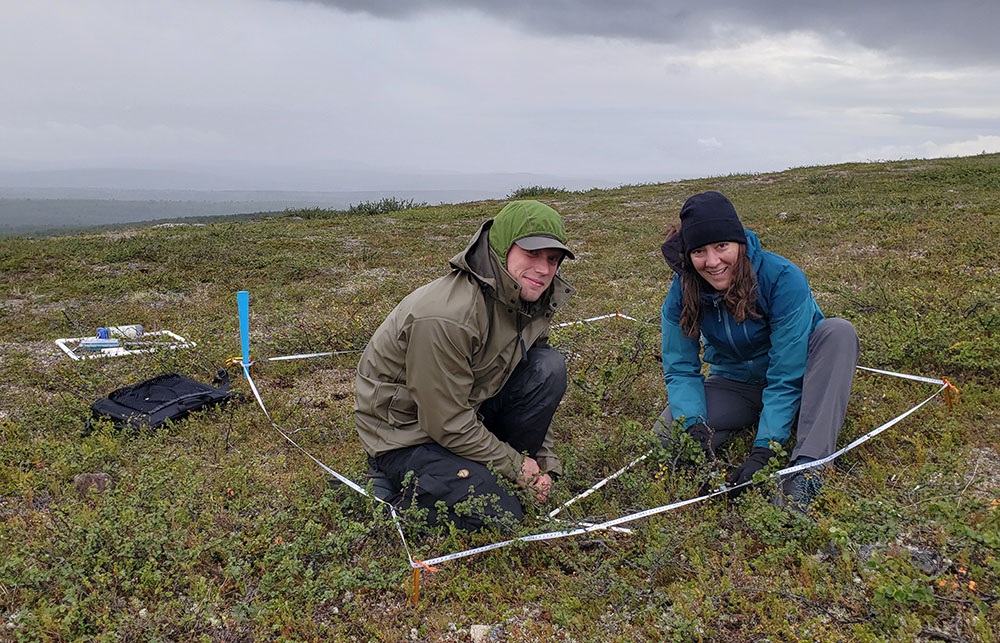
That’s why an international project led by NAU researchers, which has resulted in the first high-resolution maps of plant biomass and woody plant dominance in the Arctic, is so important. It establishes baseline conditions for the year 2020 and allows scientists to track changes moving forward. They used satellite imagery, machine learning and field data collected from more than 600 sites to create these maps, which reveal detailed patterns of vegetation linked to climate, terrain and past disturbances—all of which could play an important role in carbon accounting, conservation and climate modeling.
“The Arctic is a bit of a canary in the coal mine for climate change and has impacts across the rest of the globe, including right here in Arizona,” said Katie Orndahl, a research scientist in the School of Informatics, Computing, and Cyber Systems (SICCS) and first author on the paper, published in Remote Sensing of Environment. “The Arctic is ground zero for climate tipping points—thresholds which, if crossed, will likely lead to irreversible, abrupt and dangerous impacts.”
The study is groundbreaking in its depth and participation; 49 researchers from 34 institutions in six countries collected data, including Logan Berner, assistant research professor in SICCS and the second author on the paper; Regents’ Professor Michelle Mack from the Department of Biological Sciences; and Regents’ Professor Scott Goetz from SICCS.
What they did and why it matters
The research builds on previous work by Berner and Orndahl that assembled the underlying field data from colleagues around the world. Orndahl spearheaded the modeling effort, including gathering satellite data, fitting models, mapping biomass (the amount of living plants in an area) and analyzing map data. Linking the available data was critical to this work, Berner said.
“The Arctic is undergoing rapid environmental changes that are impacting plant biomass, but until now, we lacked a detailed understanding of this fundamental ecosystem attribute, let alone how it’s changed in recent decades,” he said.
Besides establishing baseline conditions for the year 2020, the maps also allow scientists to virtually visit any place throughout the biome and learn more about the area, providing a snapshot of conditions in the Arctic that helps explain ecological processes and inform decision-making.
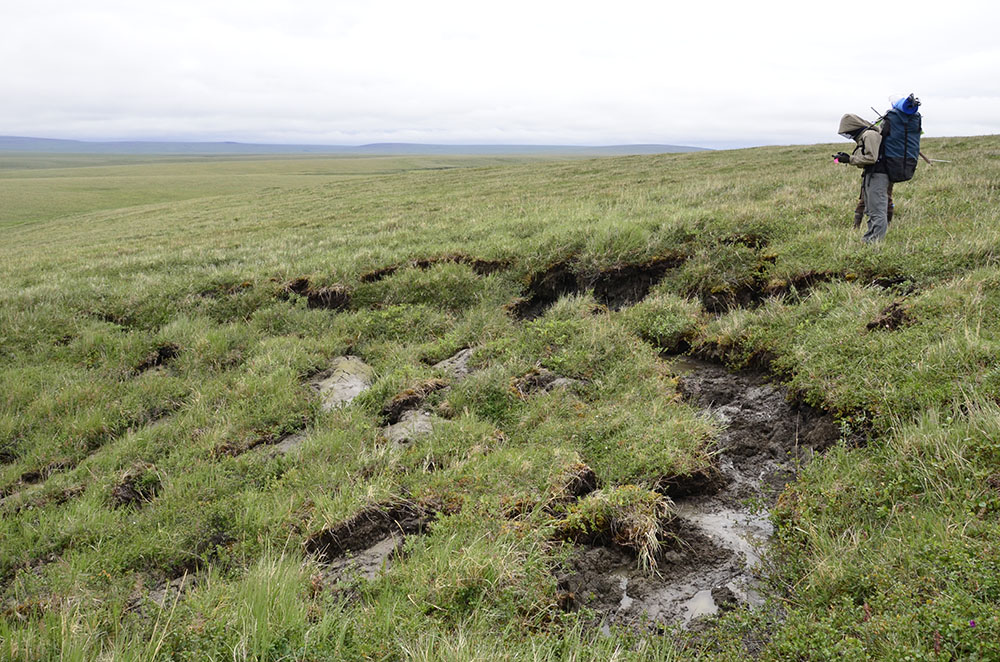
“The maps capture the legacy of disturbance across the Arctic, revealing scars left by permafrost thaw slumps, traces of human development and the patchwork of wildfire across the region,” Orndahl said. “We believe the real power lies in how they will be used moving forward. We hope these maps can be useful for a diverse set of applications and users including but certainly not limited to wildlife habitat models, carbon flux upscaling, fire fuels mapping and as input to large ecosystem or land-surface models.”
 Heidi Toth | NAU Communications
(928) 523-8737 | heidi.toth@nau.edu