


Taking a human’s temperature is a good way to determine if their body is under stress or getting sick.
The same is true of places on Earth that are prone to drought stress in a warming climate. That’s the idea behind Drought Eye, a new tool developed by Bijan Seyednasrollah of Northern Arizona University’s Center for Ecosystem Science and Society (Ecoss) and School of Informatics, Computing, and Cyber Systems (SICCS). By taking the temperature of a given region’s air and plant canopy, the tool offers farmers, scientists and city and land managers a faster way to measure whether that region may experience drought.
By comparing the temperature of the air and the temperature of the plant canopy, Seyednasrollah came up with a thermal stress indicator that is simple to calculate anywhere a weather station exists. He and colleagues at Duke University, where he completed his doctorate, then compared this thermal stress indicator against 15 years of data and found it “predicted” where droughts occurred with higher accuracy than traditional monitoring methods. The data, which lives on a public website Seyednasrollah and his colleagues created, can help communities better prepare for wildfires, water restrictions and other impacts of drought.
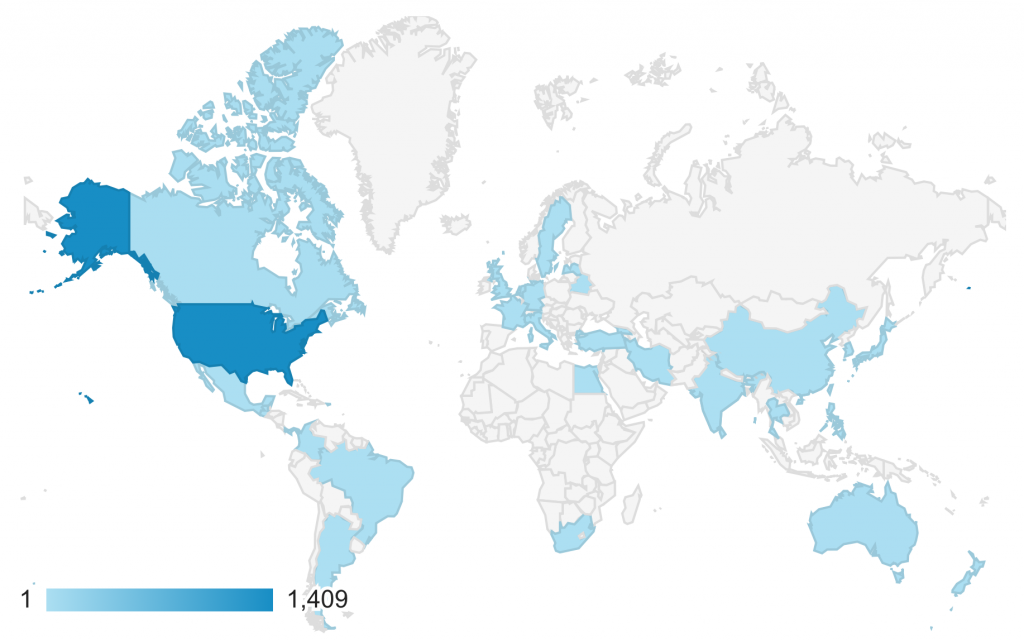
In the first two weeks Drought Eye went public, more than 1,500 visitors from 32 countries accessed the data. Those visitors included farmers, educators, scientists and researchers at the National Oceanic and Atmospheric Administration, National Aeronautics and Space Administration, Environmental Protection Agency, National Weather Service, U.S. Department of Agriculture, U.S. Forest Service, U.S. Department of the Interior and universities across the country. Seyednasrollah said he’s also received emails from people in the agricultural community and private sector asking how long the information will be available to use.
“The data is free,” he said, “and it’s going to stay free.”
Seyednasrollah said the idea for Drought Eye was sparked by a comment a reviewer made on a scientific paper he’d written. The reviewer noted that though “real-time” was in the paper’s title, the paper wasn’t truly real-time because it was relying on older data available from online sources like NASA data repositories.
“The next day I looked at it again,” Seyednasrollah said. “And I looked at my response to the reviewer and thought, well, maybe I could just do this.”
Within a week, he had built the framework for Drought Eye and its ability to fetch thermal stress data more continuously.
At NAU, Seyednasrollah is studying the effects of drought and warming on temperate deciduous phenology in the lab of SICCS professor Andrew Richardson. Using images from the open data PhenoCam network, Seyednasrollah also plans to study the tundra biome. Tundra, found in the Arctic and high mountain tops and named from the Finnish word tunturia, meaning “treeless plain,” is subject to fewer disturbances than temperate deciduous forests. That, Seyednasrollah said, makes tundra a cleaner slate on which to observe the effects of warming.
The fact that all his research is open data is important to Seyednasrollah.
“I think one reason I enjoy what I do is the feedback. I like the impact of my work,” he said. “Everything I do, and everything I’ve done, is open to the public, and that increases the impact.”
Seyednasrollah and his colleagues published the findings and methods that led to Drought Eye in the journal Agricultural and Forest Meteorology. Check out Drought Eye and the PhenoCam network online.
 Kate Petersen | Ecoss
(928) 523-2982 | kate.peterson@nau.edu